WP1.3 – Subsidence, relative sea-level rise, GIA
Work package 1.3 focusses on quantifying the deep “background” subsidence components that contribute to total subsidence signal in the Netherlands. Apart from shallow soft soil subsidence caused by for example clay or peat compaction and peat oxidation (focus of WP2), the Netherlands experience deeper “background” subsidence that occurs naturally within the Earth’s Mantle (indicated in Eq. 1). In the Netherlands this natural deep subsidence is primarily caused by two types of processes: tectonic processes and isostasy processes. These terms are traditionally studied and quantified over different spatial and temporal scales. Also, their magnitude can change over time, e.g. because of changes in loading.
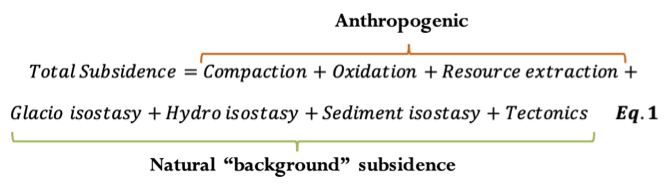
Subsidence is a combination of the effects of compaction, oxidation, resource extraction, isostacy, and tectonic movement
Long-term subsidence processes in the Netherlands
For the Netherlands, the effect of tectonic movement is seen in both the general long term subsidence of the North Sea basin (typically studied at Cenozoic time scales, millions of years (Kooi et al., 1998; Cohen et al., 2022)) and in more localized displacements over several fault systems (Late Pleistocene to Holocene time scales, tens of thousands of years). With isostasy is meant the loading of the Earth’s crust overlying the mantle, which induces viscous movement in the mantle, respectively resulting in subsidence in one place and uplift in another. An example of this is given in Figure 1, in which an ice sheet causes a change in the loading of the Earth’s crust and mantle. The response to changes in loading is partly an instantaneous elastic response and partly a slower viscous response, taking up to thousands of years. This lag in response is due to the high viscosity of the Earth’s mantle, that results in a time-dependent viscoelastic relaxation. Therefore the flow of the mantle material will continue long after the change in loading has occurred (Steffen & Wu, 2011).
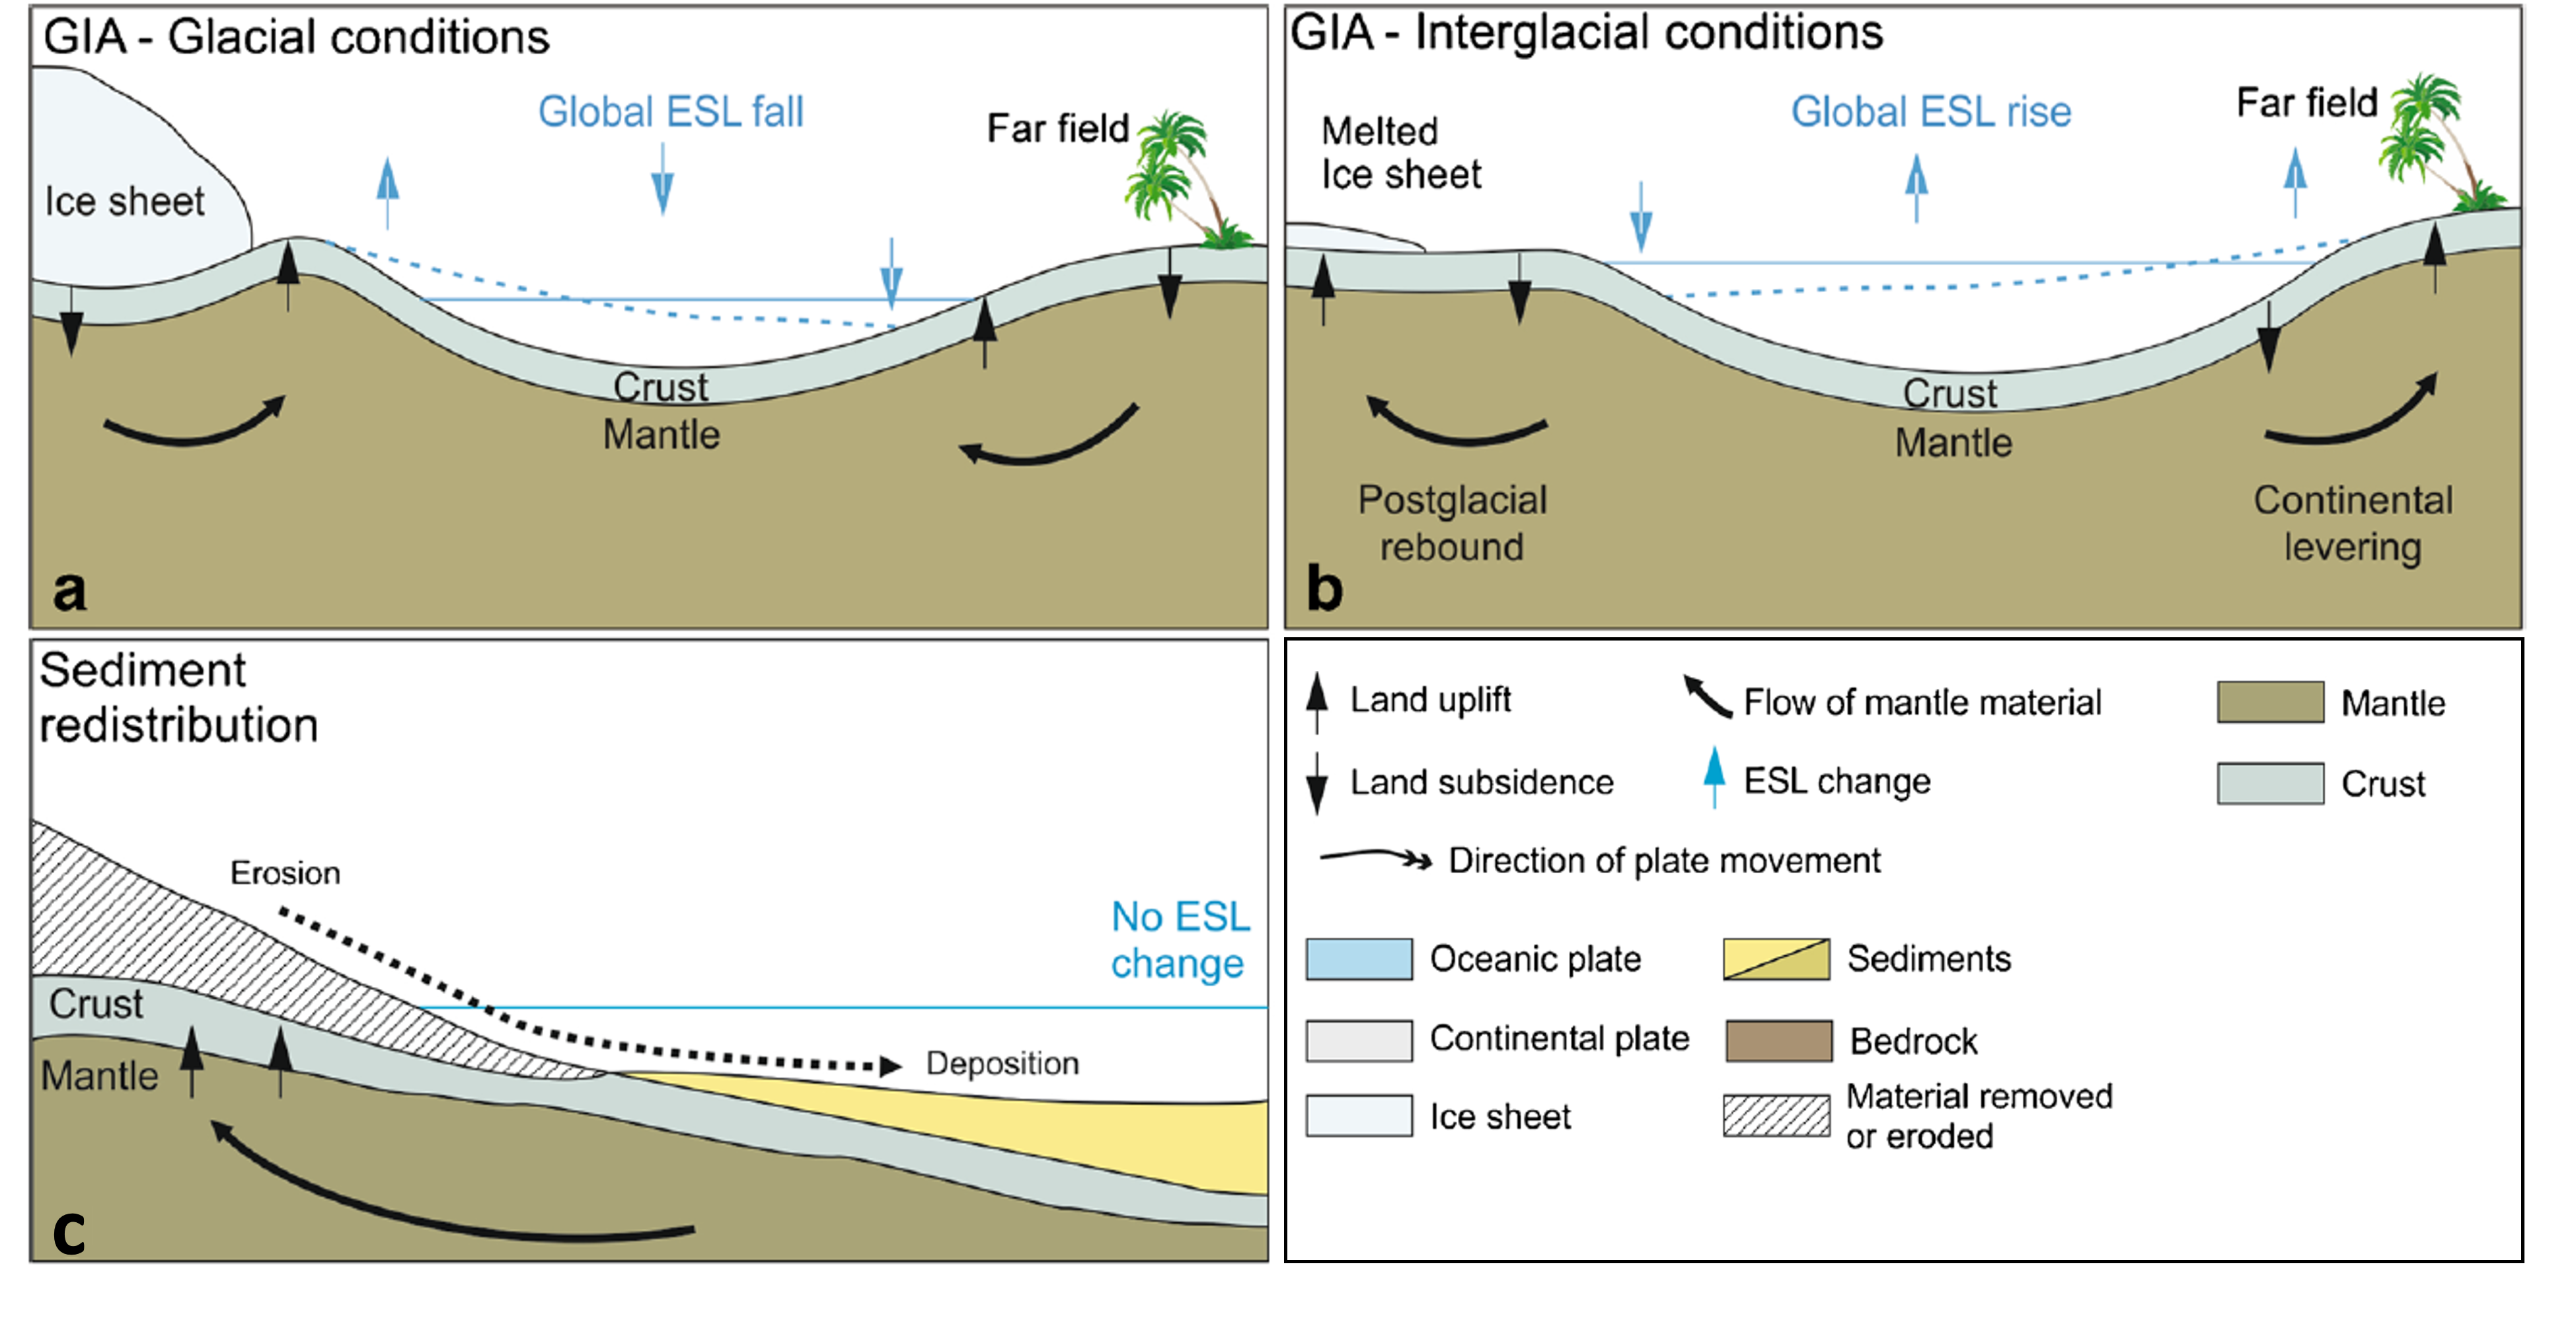
Figure 1: Schematic figure from Rovere et al. (2016) showing three isostatic processes contributing to relative sea level change. Caption from Rovere et al. (2016): a,b. glacial isostatic adjustment (GIA) and redistribution of water masses following ice sheet melting (‘fingerprint’). c. isostatic adjustment due to the redistribution of sediments, specifically following erosion from the coastal plain and deposition on the continental shelf. (Rovere et al., 2016)
Three variants of isostasy are at play in the Netherlands, acting on different time scales: hydro-isostasy, glacio-isostasy and sediment isostasy. Hydro-isostasy is caused mainly by the loading of water in the North Sea basin, adding more weight and causing subsidence. An example of this is when the North Sea basin filled up with water after the last glacial period (Johnston, 1995). Glacio-isostasy is caused by the loading and unloading of ice, and has a more important role over timespans equal to glacial-interglacial cycles (10 kyr to 100 kyr). The combined effect of glacio-isostasy and hydro-isostasy is called glacial isostatic adjustment (GIA, Figure 1). For example, in the Netherlands we experience GIA-related subsidence resulting from the last deglaciation (glacio-isostasy owing to the disappearance of ice loads on Scandinavia and the British Isles) and resulting reflooding of the North Sea (hydro-isostasy owing to transgression). This causes mantle material to slowly flow back underneath Scandinavia, the former ice sheet centre of mass in the last glacial period (Lambeck, 1995; Lambeck et al., 1998; Steffen & Wu, 2011). In numerical GIA-models glacio-isostasy and hydro-isostasy are combined with solving the sea level equation, which describes the distribution of the water loading around the world (Farrell and Clark, 1976).
In the Netherlands, sediment isostasy is caused by the continuous trapping of sediment to the coastal plains of the North Sea Basin, adding more weight which results in subsidence (Figure 1.c) (Dalca et al., 2013; Kooi et al., 1998; Rovere et al., 2016). This results in more permanent loading on the long time-scales, since the North Sea functions as a sediment depocenter. But on the short time-scales there is temporary loading as well due to dynamics of the Holocene coastline. Sediment isostasy is not the main focus of this project, but still needs to be taken into account when assessing subsidence over the Holocene.
Paleo-groundwater data
The main focus of work package 1.3 is on improving the quantification of the GIA signal in the Netherlands and determining the relative contribution of GIA and tectono-sedimentary loading and sinking to regional scale subsidence in the Netherlands during the Holocene. To do this, we use a data-based approach, using geological paleo-groundwater level indicators.
For this research we use mostly 14C-dated basal peat samples as paleo-groundwater level indicators, i.e. samples from peat layers overlying the Pleistocene (sandy) surface. In Figure 2 an example is shown of a basal peat layer on a Pleistocene cover sand dune near Urk, Flevoland. On the right is shown the sample box that was extracted for further analysis and for dating of the basal peat. The rising sea level during the Holocene caused a concurrent rise of the coastal groundwater levels (GWL) up to tens of kilometres landward (Koster et al., 2017). Within the Dutch coastal plain this caused a wetting and inundation of the Pleistocene surface. Subsequently, large-scale peat growth was possible in these wetland areas. The start of the peat growth marks the timing of inundation at that location. Therefore, by sampling and dating these peat layers in the subsurface we can reconstruct the past GWL and sea level (Berendsen et al., 2007; Van de Plassche et al., 2010; Quik et al., 2022). An important notion is that this is a relative water level reconstruction, because the depth at which the peat layers can be found is influenced by vertical land motion in deeper layers (e.g. due to GIA and tectono-sedimentary loading and sinking).
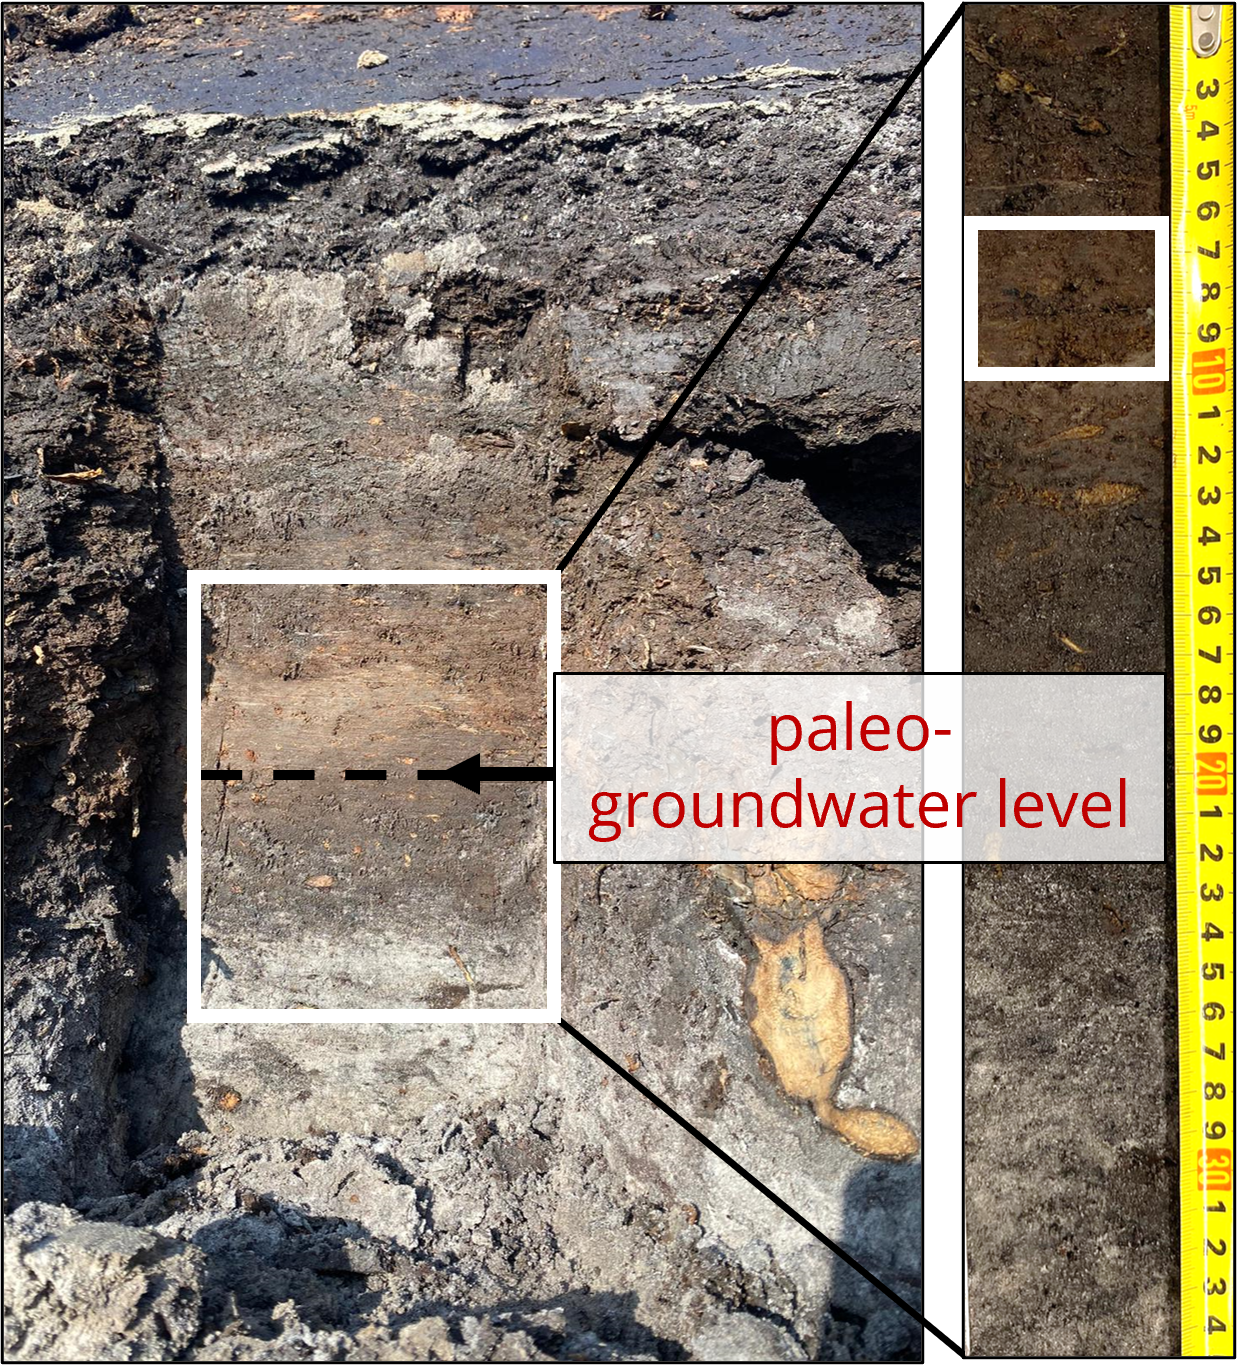
Figure 2: Basal peat layer on top of a Pleistocene cover sand dune at an archaeological excavation near Urk, Flevoland. On the right side the sample box is shown that was taken for further analysis to determine the exact contact between sand and peat and for 14C-dating.
A dataset of more than 500 paleo-GWL indicators throughout the Dutch coastal plain was reviewed and updated for this project. This dataset is used to make a spatially and temporally continuous reconstruction of the relative Holocene GWL rise in the Dutch coastal plain in four dimensions (X-, Y-, Z- and Time, Figures 3 and 4). The interpolation method that was used is based on the methods previously used by Cohen (2005) and Koster et al. (2017). Currently, the number of suitable paleo-GWL indicators is not evenly distributed over the research area, since there are more samples in the western part of the Netherlands and in the Rhine-Meuse delta than there are in the north and south. One objective of this project is to add additional paleo-GWL indicators to the database, to improve the data coverage within the Netherlands.
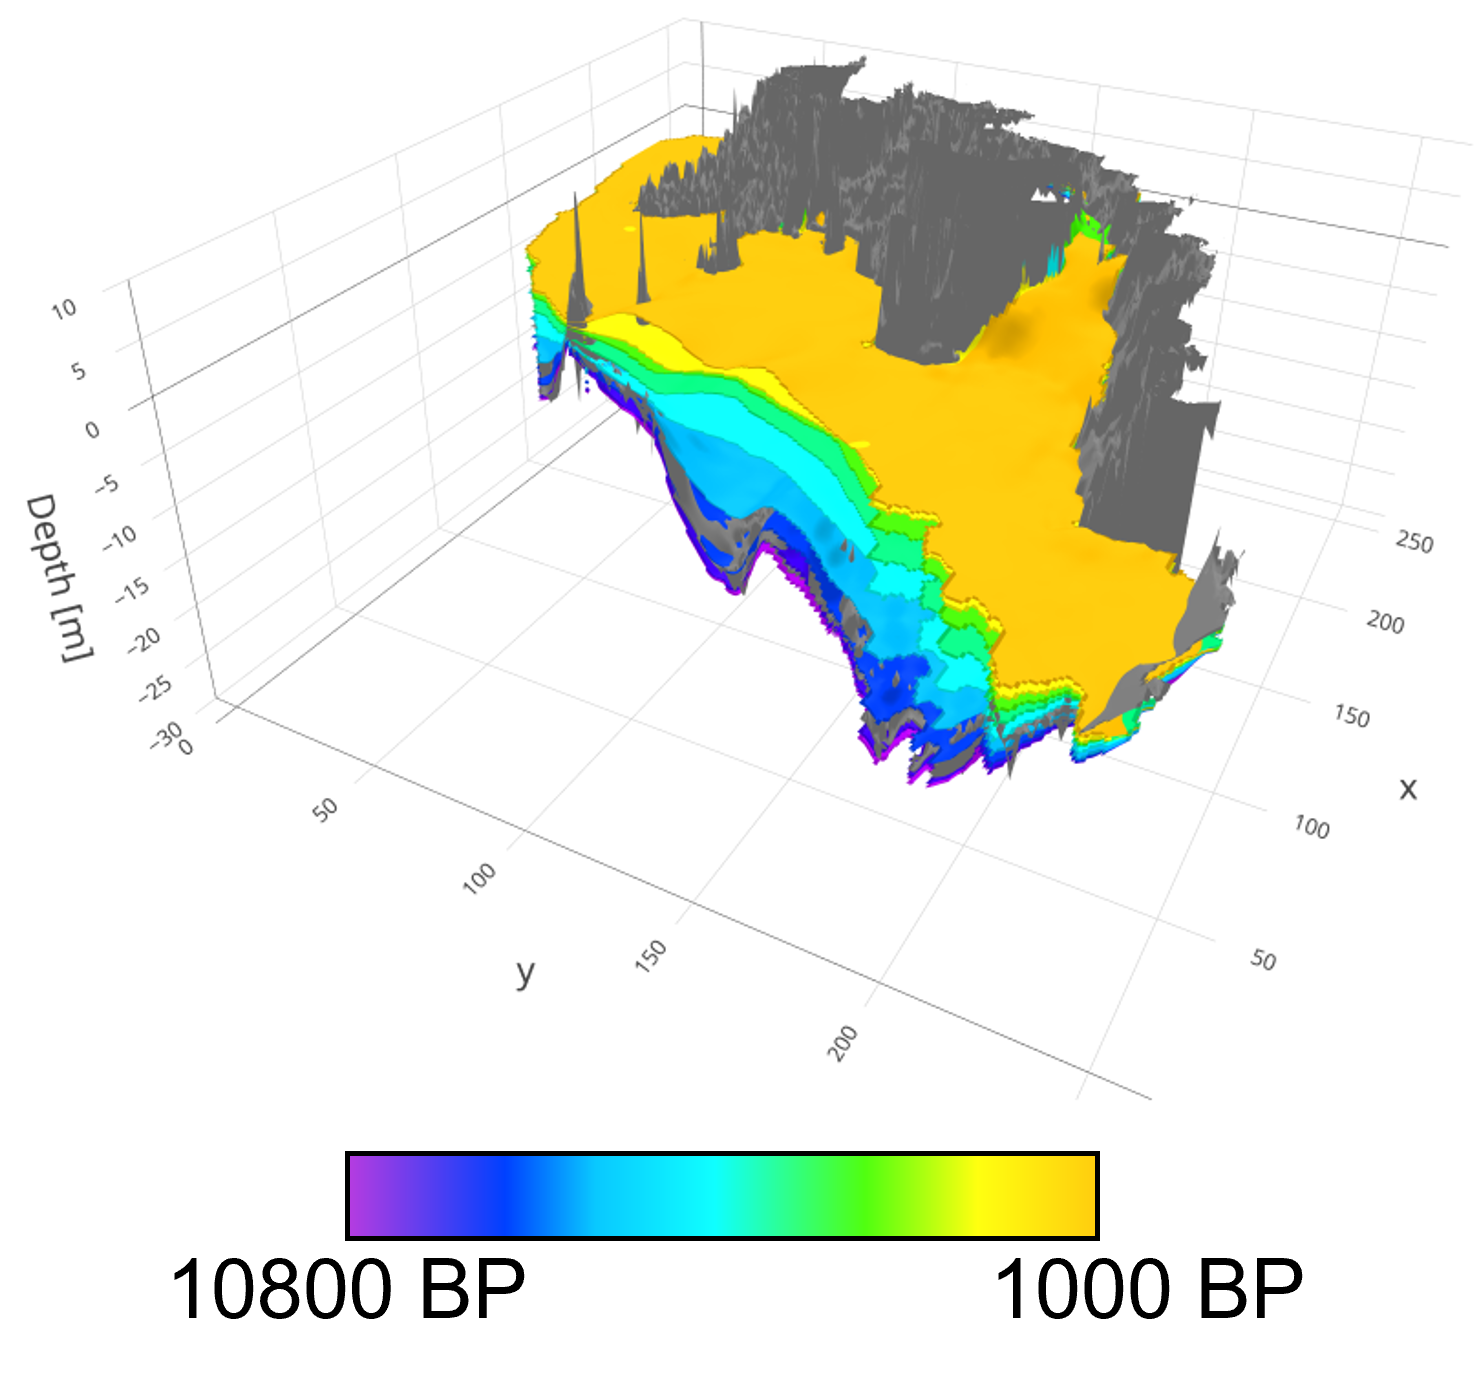
Figure 3: Groundwater interpolation output: 3D visualisation of Holocene groundwater levels in the Netherlands
Figure 4: Predicted relative Holocene groundwater levels for every 1000 years based on the spatial-temporal interpolation output.
Project aims
The aim of work package 1.3 is to improve the estimation of GIA induced subsidence in the Netherlands by:
- Updating groundwater level and sea-level index point database for the Netherlands
- Reconstructing Holocene relative GWL and sea level rise along the entire Dutch coastline
- Disentangling Holocene GIA and tectonic basin loading and sinking signals
- Evaluating the difference between Holocene and current “background” subsidence rates
- Track and tracing the use of GIA modelling in subsidence spatial forecasting (WP3), notably for scenario’s that include sea-level rise (SLR) in the 21st century
Team
The PhD candidate working on WP1.3 is Kim de Wit (UU), supervised by Kim Cohen (UU), Roderik van de Wal (UU, IMAU) and Esther Stouthamer (UU), with additional support from Wouter van der Wal (TU Delft) and Paolo Stocchi (NIOZ).
Research Output as of January 2023 (First Author Only)
[1] de Wit, K., van de Wal, R. S. W., and Cohen, K. M.: Reconstructing large scale differential subsidence in the Netherlands using a spatio-temporal 3D paleo-groundwater level interpolation, EGU General Assembly 2022, Vienna, Austria, 23–27 May 2022, EGU22-8350, https://doi.org/10.5194/egusphere-egu22-8350, 2022.References
Berendsen, H. J. A., Makaske, B., Plassche, O. van de, Ree, M.H.M. van, Das, S., Dongen, M. van, Ploumen, S. & Schoenmakers, W. (2007). New groundwater-level rise data from the Rhine-Meuse delta–implications for the reconstruction of Holocene relative mean sea-level rise and differential land-level movements. Netherlands Journal of Geosciences/Geologie en Mijnbouw, 86(4), 333-354.
Cohen, K. M. (2005). 3D geostatistical interpolation and geological interpretation of paleo–groundwater rise in the Holocene Coastal Prism in the Netherlands.
Dalca, A., Ferrier, K., Mitrovica, J., Perron, J., Milne, G., & Creveling, J. (2013). On postglacial sea level—III. Incorporating sediment redistribution. Geophysical Journal International, 194(1), 45-60.
Farrell, W. E., & Clark, J. A. (1976). On postglacial sea level. Geophysical Journal International, 46(3), 647-667.
Johnston, P. (1995). The role of hydro-isostasy for Holocene sea-level changes in the British Isles. Marine Geology, 124(1-4), 61-70.
Kooi, H., Johnston, P., Lambeck, K., Smither, C., & Molendijk, R. (1998). Geological causes of recent (∼ 100 yr) vertical land movement in the Netherlands. Tectonophysics, 299(4), 297-316.
Koster, K., Stafleu, J., & Cohen, K. M. (2017, Dec). Generic 3D interpolation of Holocene base-level rise and provision of accommodation space, developed for the Netherlands coastal plain and infilled palaeovalleys. Basin Research, 29(6), 775-797.
Lambeck, K. (1995). Late Devensian and Holocene shorelines of the British Isles and North Sea from models of glacio-hydro-isostatic rebound. Journal of the Geological Society, 152(3), 437-448.
Lambeck, K., Smither, C., & Johnston, P. (1998). Sea-level change, glacial rebound and mantle viscosity for northern Europe. Geophysical Journal International, 134(1), 102-144.
Rovere, A., Stocchi, P., & Vacchi, M. (2016). Eustatic and relative sea level changes. Current Climate Change Reports, 2(4), 221-231.
Steffen, H., & Wu, P. (2011). Glacial isostatic adjustment in Fennoscandia—a review of data and modelling. Journal of geodynamics, 52(3-4), 169-204.
Van de Plassche, O., Makaske, B., Hoek, W. Z., Konert, M., & Van der Plicht, J. (2010). Mid-Holocene water-level changes in the lower Rhine-Meuse delta (western Netherlands): implications for the reconstruction of relative mean sea-level rise, palaeoriver-gradients and coastal evolution. Netherlands Journal of Geosciences, 89(1), 3-20.
Quik, C., Palstra, S. W.L., van Beek, R., van der Velde, Y., Candel, H.J., van der Linden, M., Kubiak-Martens, L., Swindles, G.T., Makaske, B. & Wallinga, J. (2022). Dating basal peat: The geochronology of peat initiation revisited. Quaternary Geochronology, 101278.